Motivations

Overspecialization in Science
Very difficult to cross the branches of science.Slow learning curve
Very difficult to perform self-education path
Motivations
Science & Research
Multidisciplinary approach
Needs of theoretical framework, instruments and data from various domains.
Complex theorethical and computational tools
Easy to use frameworks, reproducibility of results.

Motivations
I was born in Rome
I had a very difficult childhood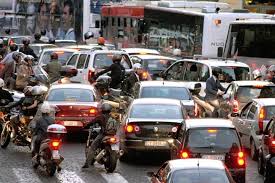
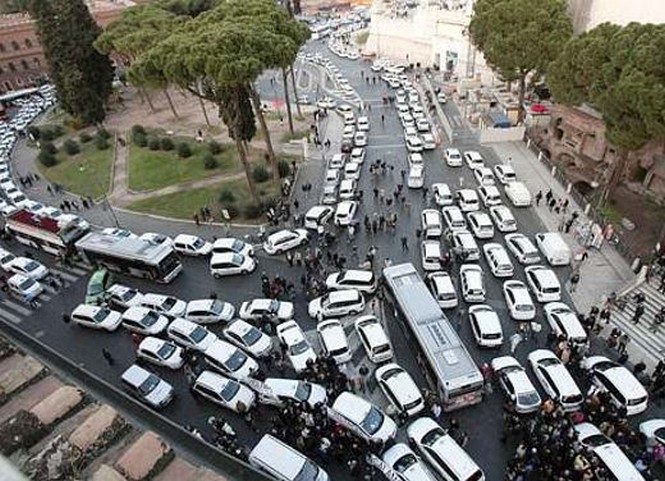
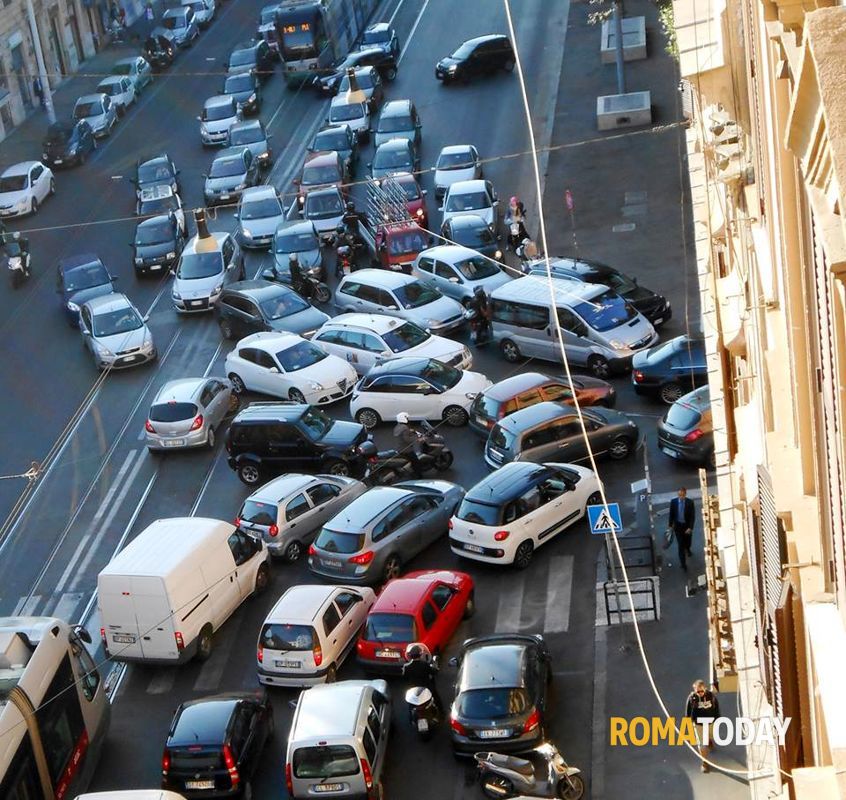
Rome public transports are
"not so good".
And how much compared to the other cities?
Where is the better served place in the city?
And in the world?
Urban Accessibility Measures
Huge scientific literature
The first definition more than 50 years ago.
Many definitions - low computations
Few attemps to compute it at large scale.
First goal:
to measure the urban accessibility at large scale

Boundaries and Tessellation
isochrones
First step towards an accessibility measure:
The larger isochrones are, the faster you move.

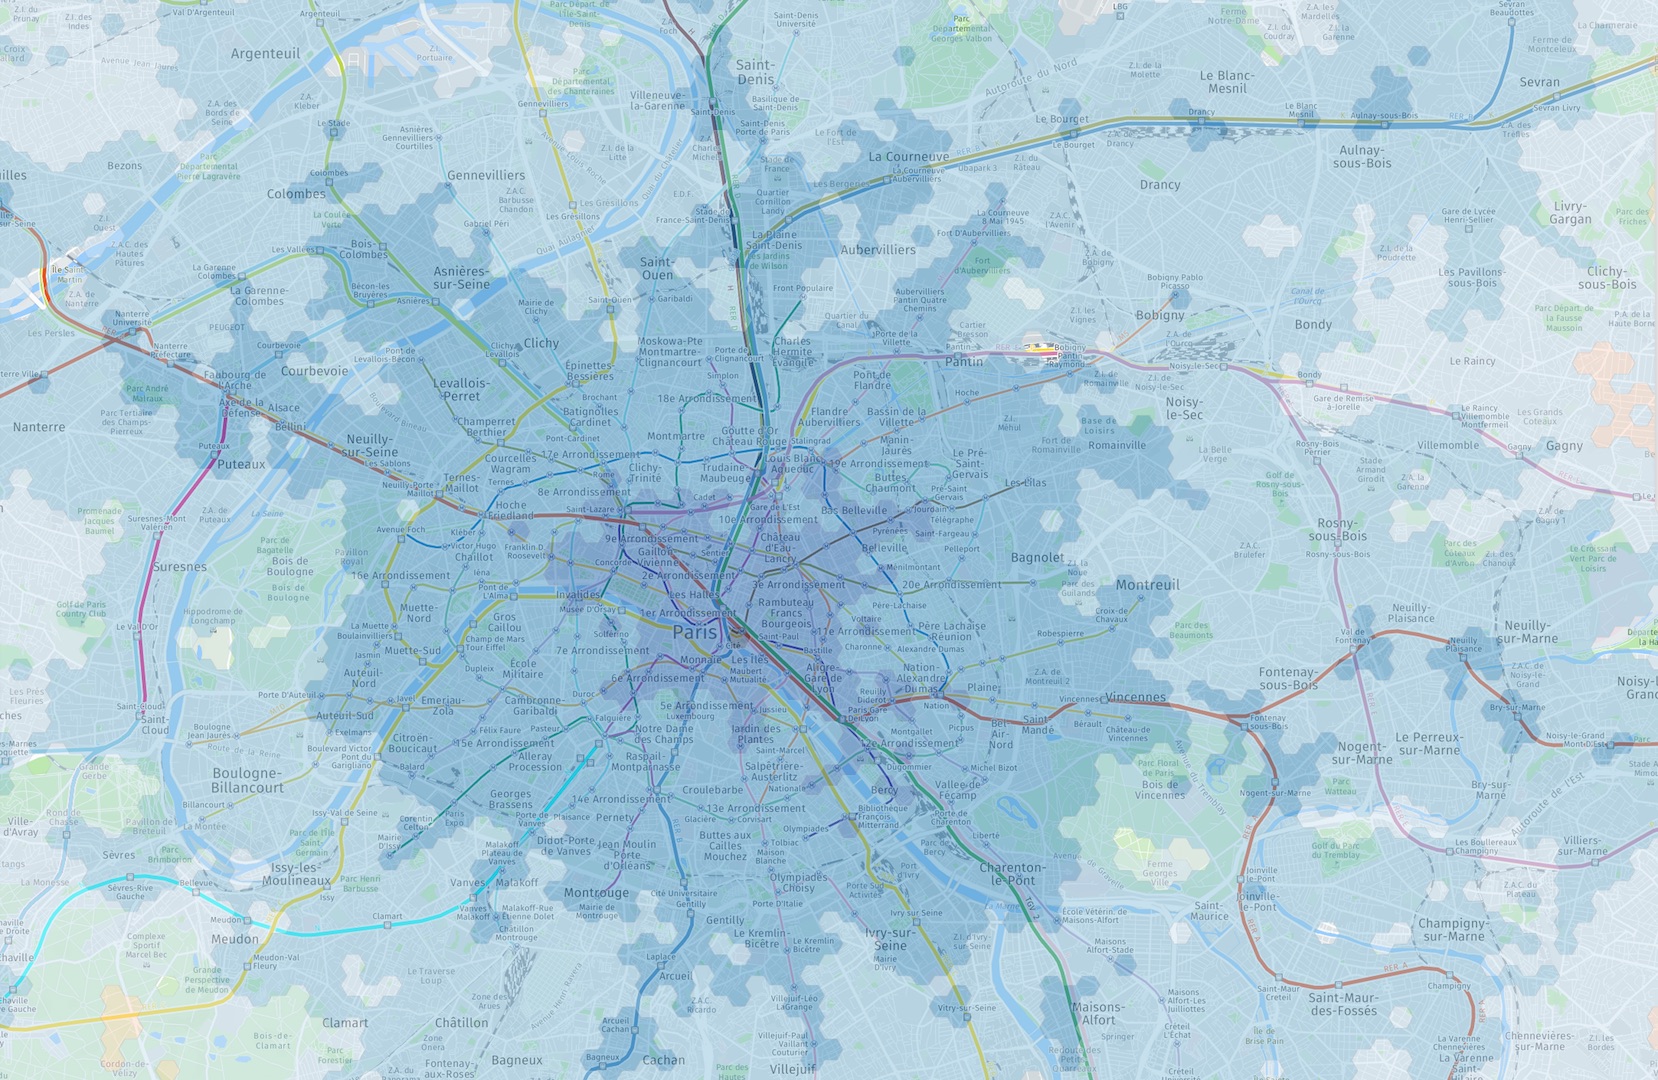
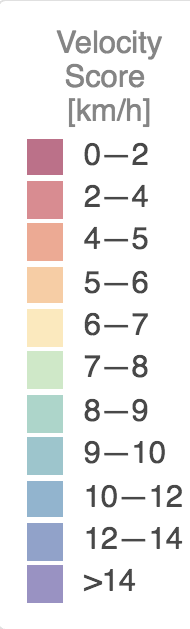
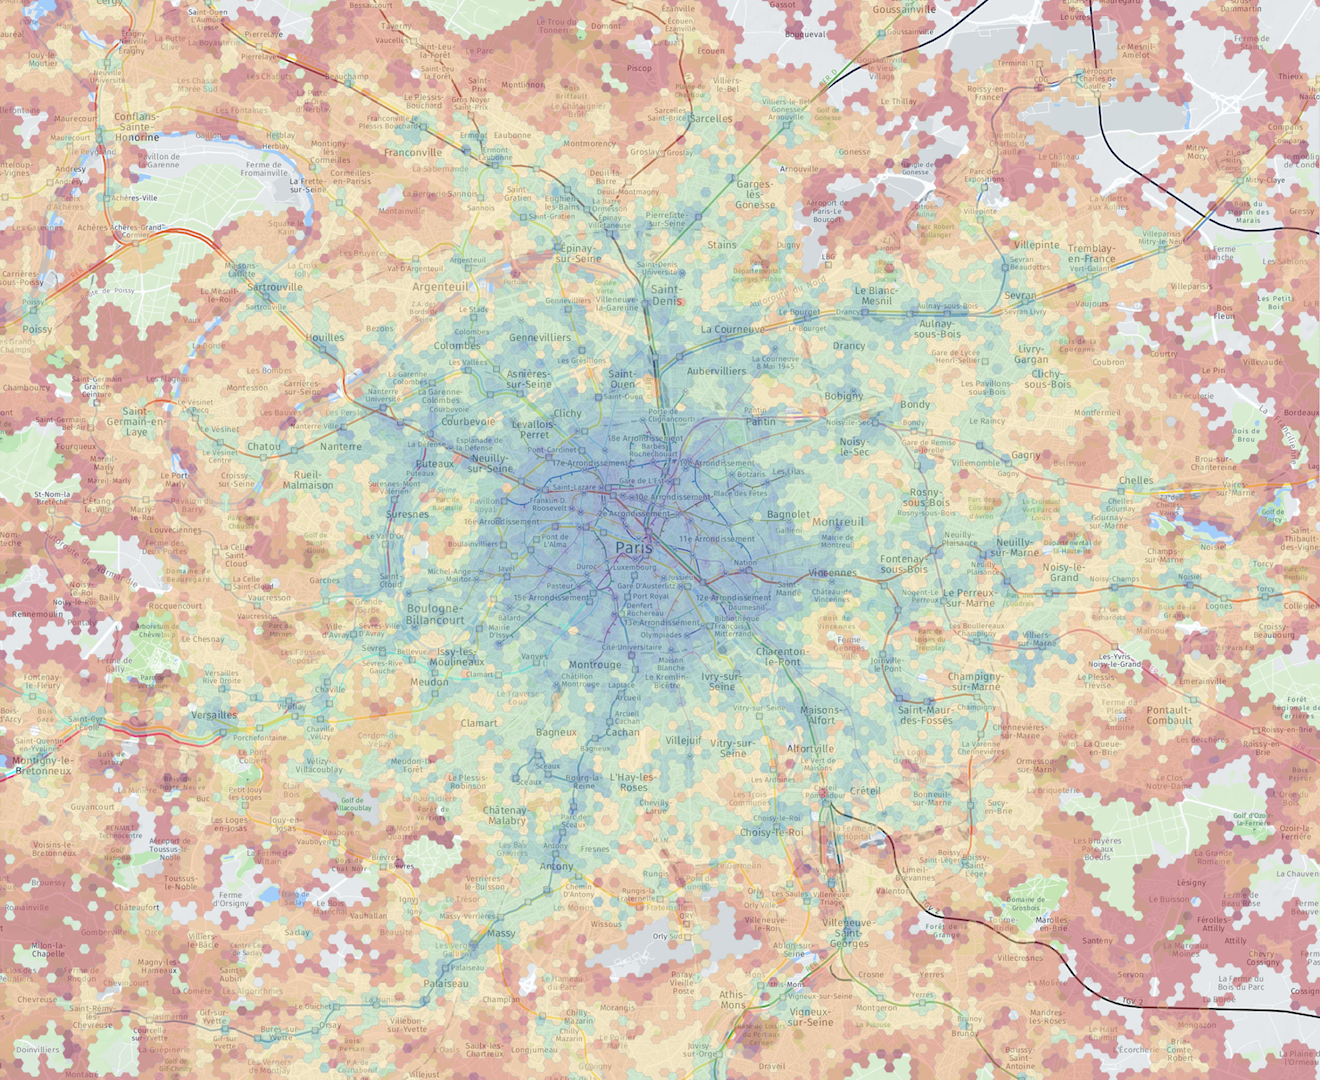
Velocity Score
Average velocity taking a random direction
proportional to the number of places reachable in a fixed amount of time
Paris
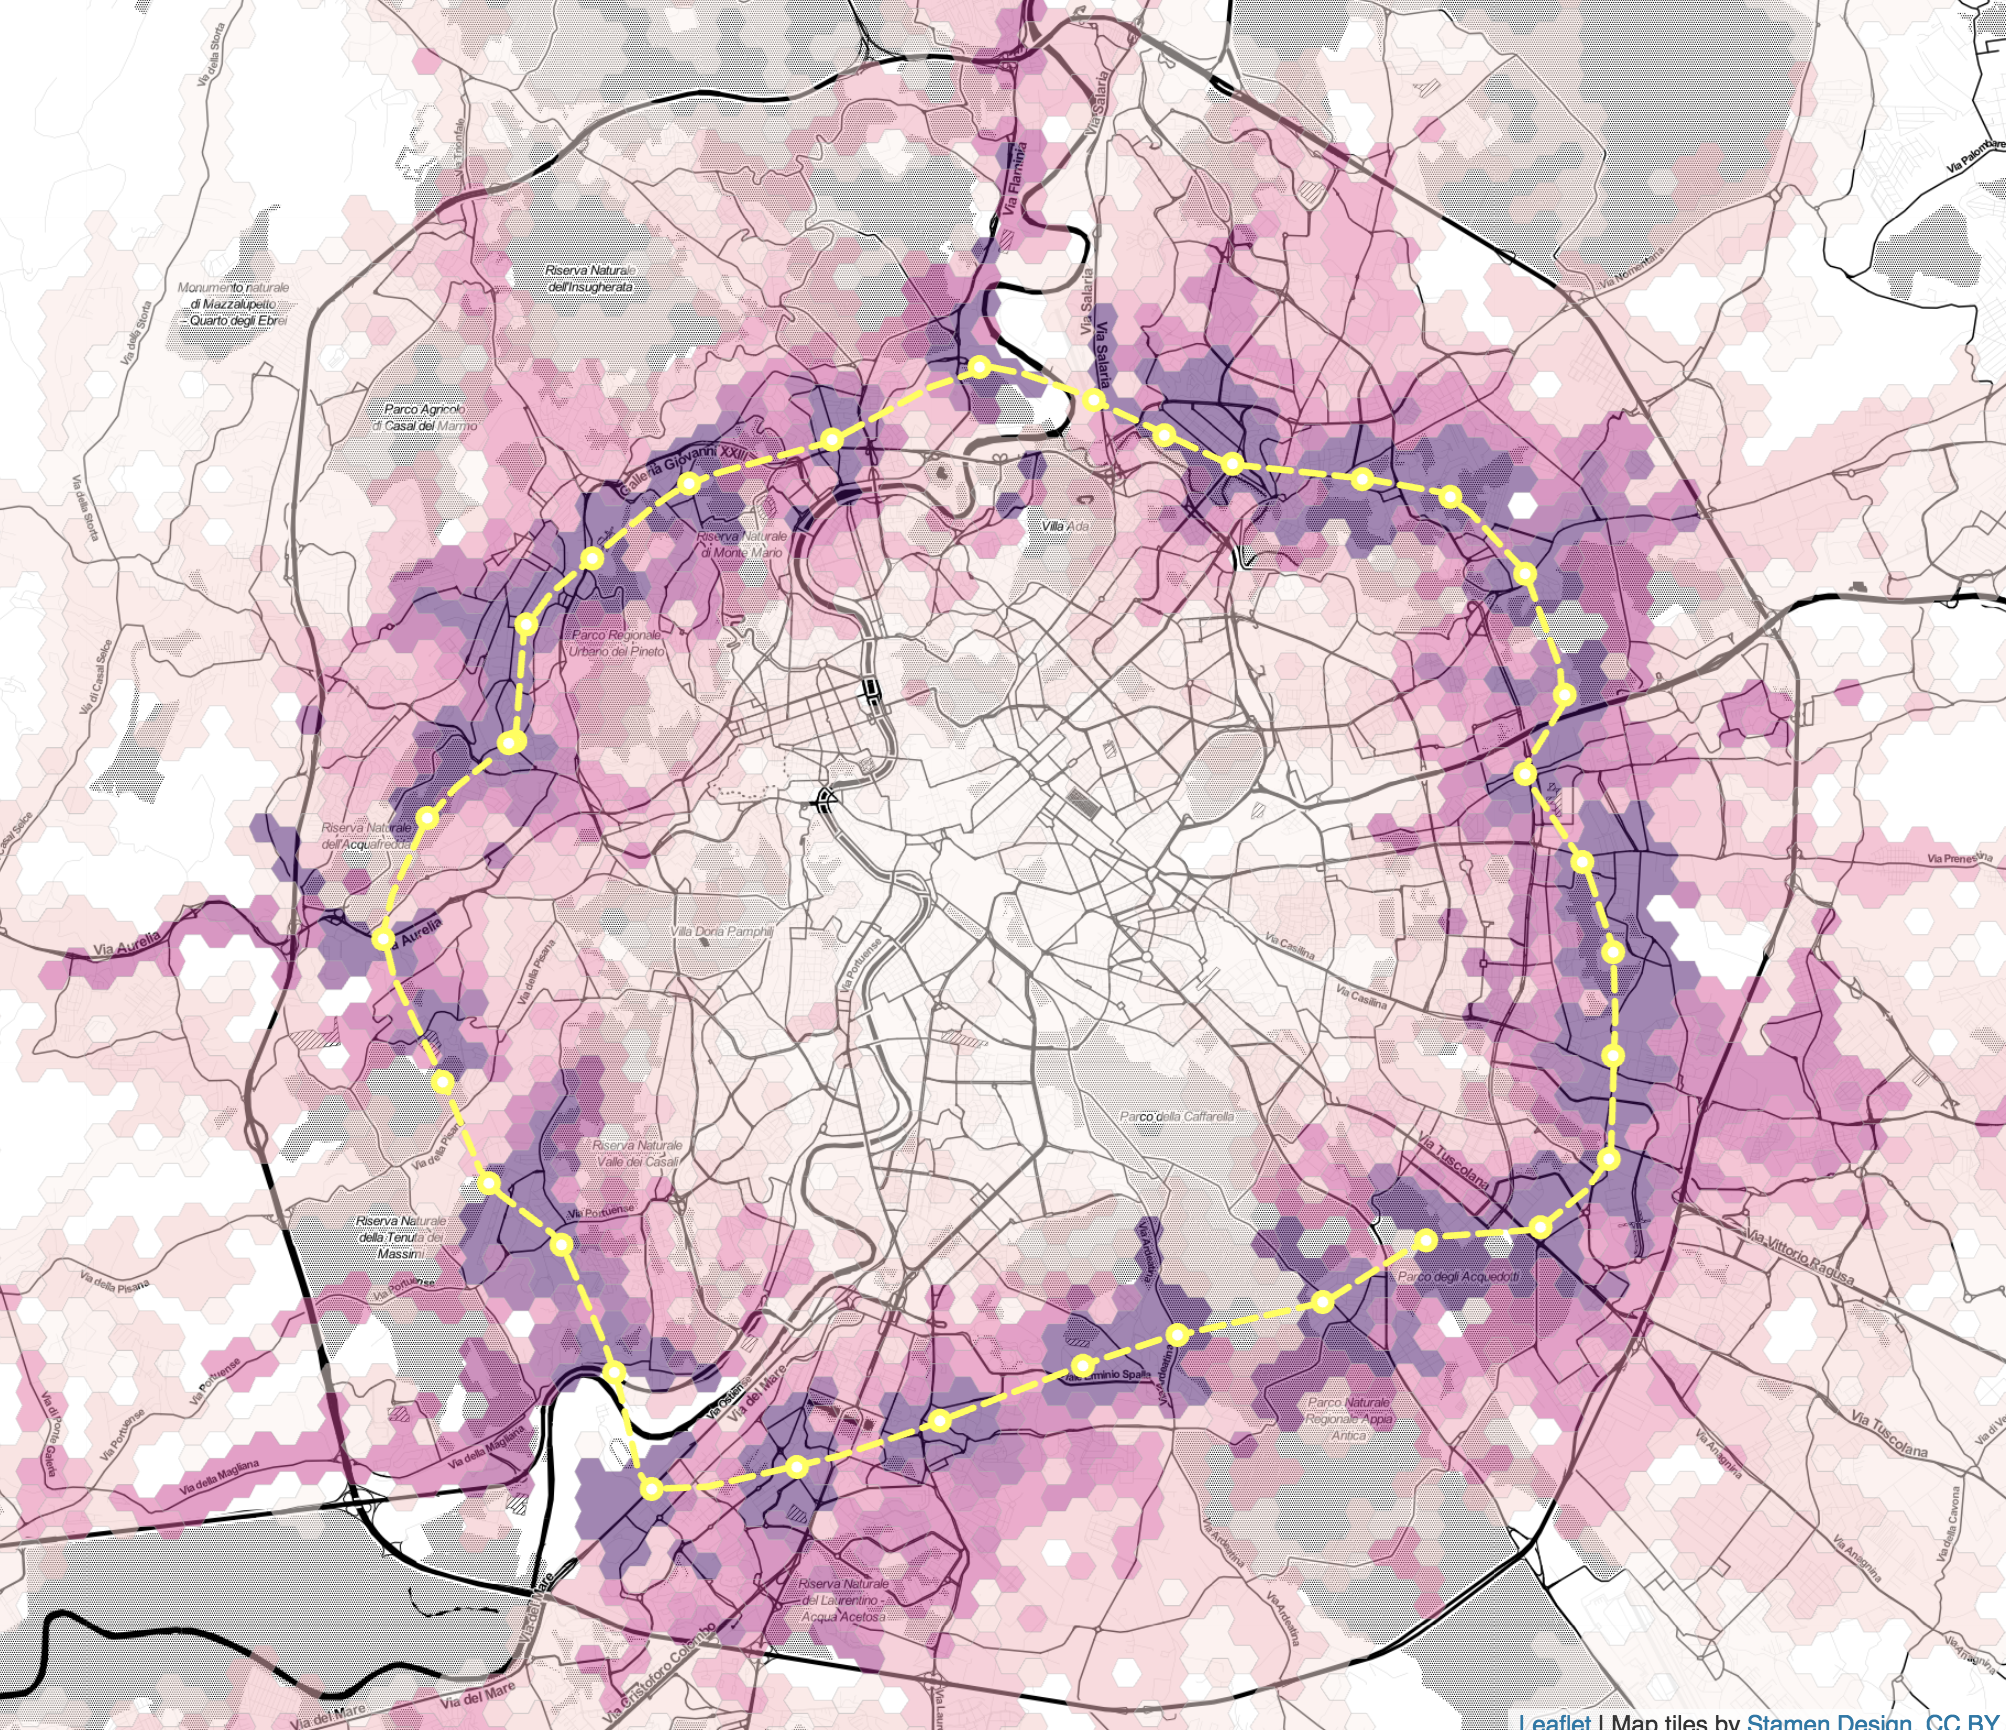
Rome
interactive maps and more cities:
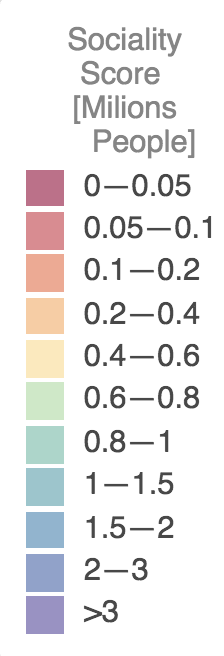
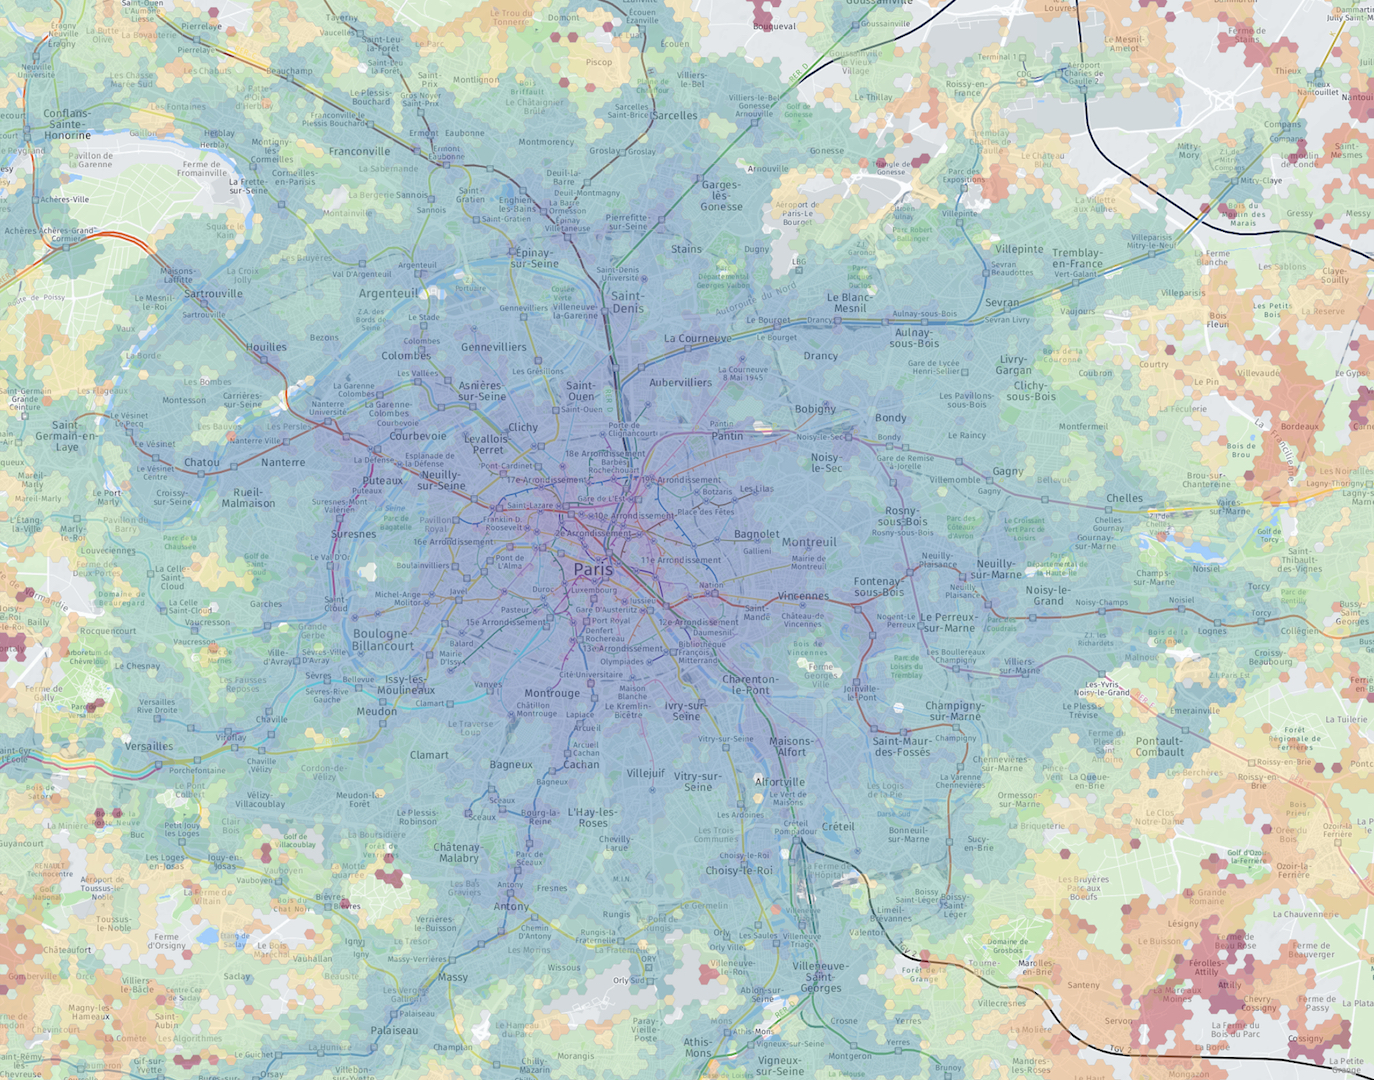
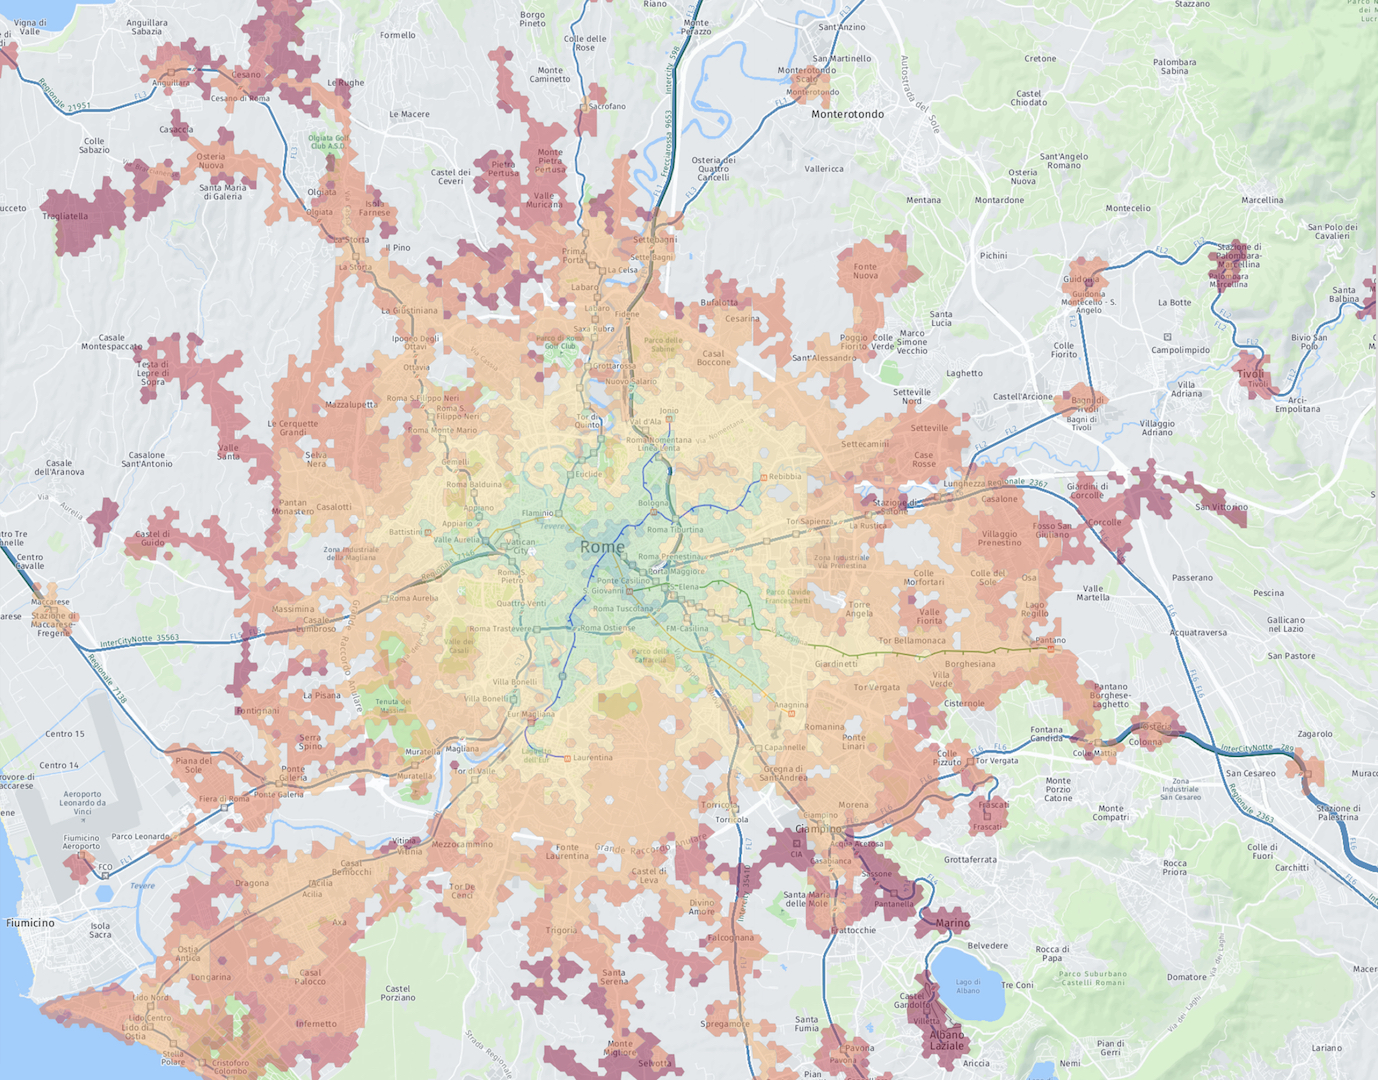
Sociality Score
Number of people is possible to reach in a typical day trip starting from a point.
Paris
Rome
interactive maps and more cities:
City Velocity
Velocity Score per person

Inequality distribution of
accessibilities

Exponential decay from the center of the city.
Exponential decay of the Velocity Score with the time distance from the center.

Why these patterns are observed in all cities?
Are these inequalities unavoidable?
Can be modified or optimized?
In which way?
I don't known.
CityChrone
Interactive platform
Now I know how much Rome public transports suck
What we have to do to reach Paris?
What are the best interventions given a budget?
Let's Play!
CityChrone
Interactive platform for exploring new scenario
Budget: 5 Bilion €
Name Scenario: Gram Author: Pietro