Your browser doesn't support the features required by impress.js, so you are presented with a simplified version of this presentation.

For the best experience please use the latest Chrome, Safari or Firefox browser.

Indaco Biazzo


Università "La Sapienza" - Rome, ISI Foundation - Turin
personal page -- http://ocadni.github.io/
citychrone -- www.citychrone.org
Today:

  • Introduction:
    Motivation and goals.
  • CityChrone Platform:
    an interactive platform for urban accessibility and planning support.
  • The future of public transports in cities.
    The final solutions.
Motivation:

1 - Scientific production.
Science should help to understand the world, simplifying it.
  • Models should be less complex than sistems under study.
  • Very slow learnig curve.
  • Over-specialization in science.
Motivation:

2 - Sharing of the scientific results.
One really has to write a “manuscript” (format invented in late 16th century) to publish scientific results today?
Motivation:

3 - difficult childhood.
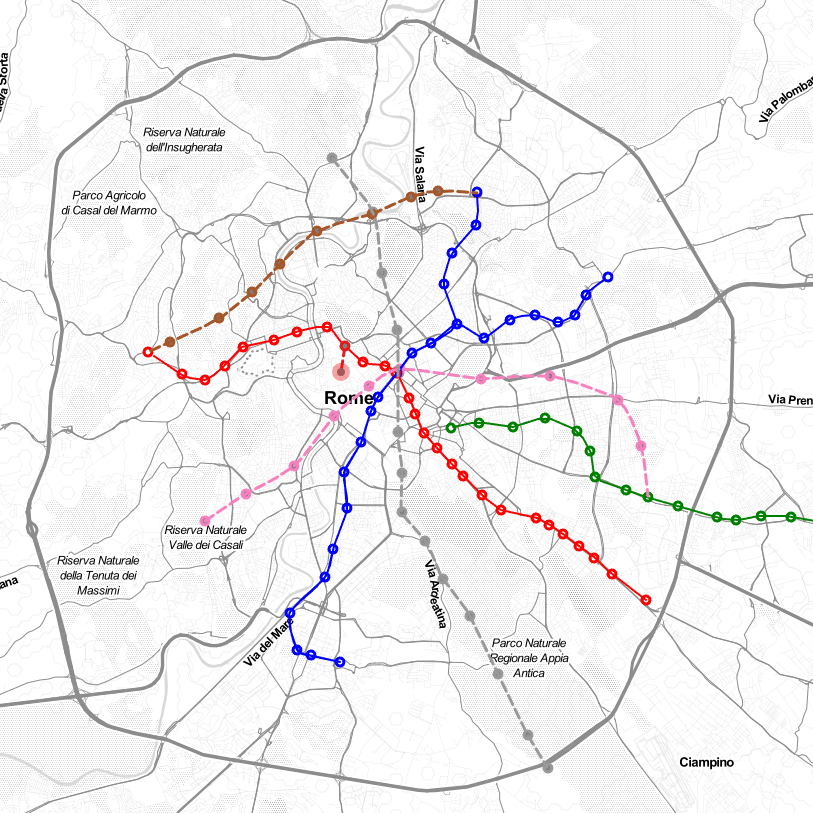
I was born in Rome.

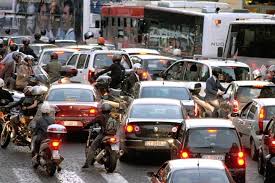
Rome public transport are "not so good".
Ok. But how much compared to the other cities?

Where is the better served [by public transport] place in the city?
And in the world?

CityChrone: the context
Accessibility measure:

Huge scientific literature starting at least 50 years ago.


There is a numerless of different definitions of accessibility.

But as far I know there are no studies that actually compute it at large scale.


A real science of city needs quantitative measurement.

The current work must be considered at first as an experimental work, meaning we define procedure to measure quantities and then we measured them.

Data, visualizations, algorithms

Open data sources used


Public Transports Schedules (GTFS format) - transitfeeds


Street graph - OpenStreetMap


Populations data - Eurostat Population Grid, SEDAC


city data and boundary - measuringurban - oecd

DataViz inspirations


StravaLab


GTFS


DataViz

Algorithms - routing


Walking routing - OSRM


New public transport routing alogrithms - CSA, RAPTOR


CityChrone
Science for City

Boundaries and Tessellation.

We can compute isochrones.
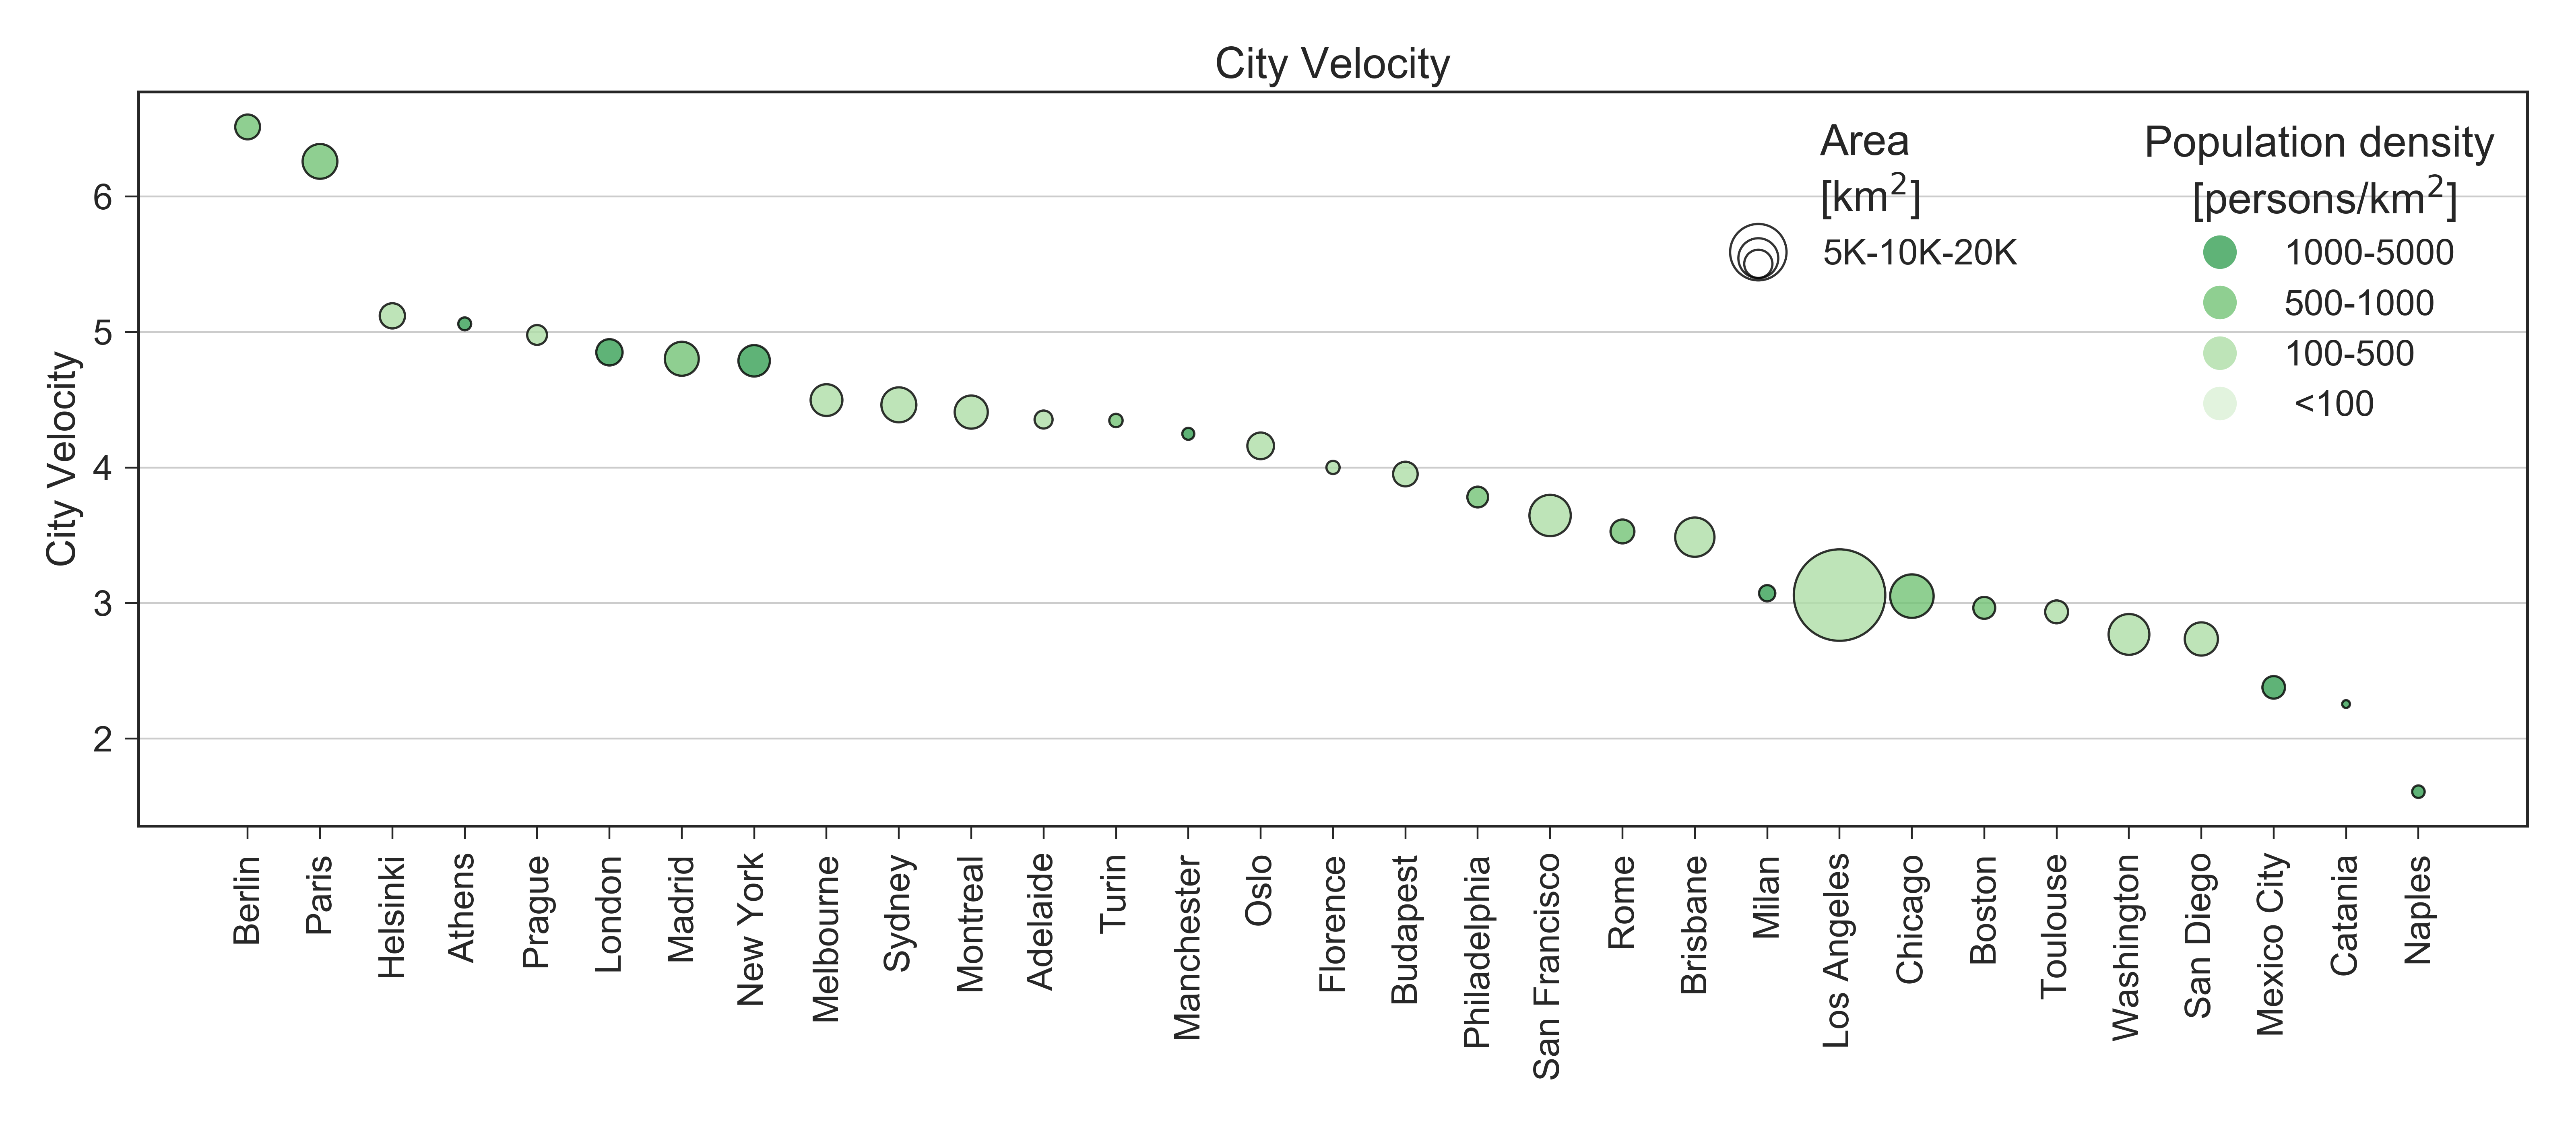
Velocity Score:
Consider the Area of the Isochrone a time \(t\) computed in \(P\): \begin{equation} r(t,P) = \sqrt{\frac{A(t, P)}{\pi}} \end{equation}
dividing by time, we obtain a quantity with the dimension of a velocity:
\begin{equation} v(t,P) = \frac{r(t,P)}{t} \end{equation} Integrating over time: \begin{equation} v_{score}(P) = \int_0^{\infty} v(t, P) f(2t) dt, \end{equation}
\(f(t)^1\) is the daily time budget distribution for public transport.
\(^1\) Robert Kölbl, Dirk Helbing. Energy laws in human travel behaviour. New Journal of Physics 5, 48 IOP Publishing, 2003.
Sociality Score:
Consider the populations inside the Isochrone a time \(t\) computed in \(P\): \begin{equation} s(t,P) = \sum_{i \mid t_i(P) < t} p(h_i), \end{equation}
we sum over all the hexagons with time \(t_i\) less than \(t\) and \(p(h_i)\) is the population within \(h_i\).
\begin{equation} s(P) = \int_0^{\infty} s(t,P)f(2t)dt, \end{equation}
\(f(t)^1\) is the daily time budget distribution for public transport.
\(^1\) Robert Kölbl, Dirk Helbing. Energy laws in human travel behaviour. New Journal of Physics 5, 48 IOP Publishing, 2003.

Sociality Score quantifies how many citizens it is possible to reach with a " typical trip" starting from somewhere in the city
City Rankings
City Velocity
Velocity Score per person
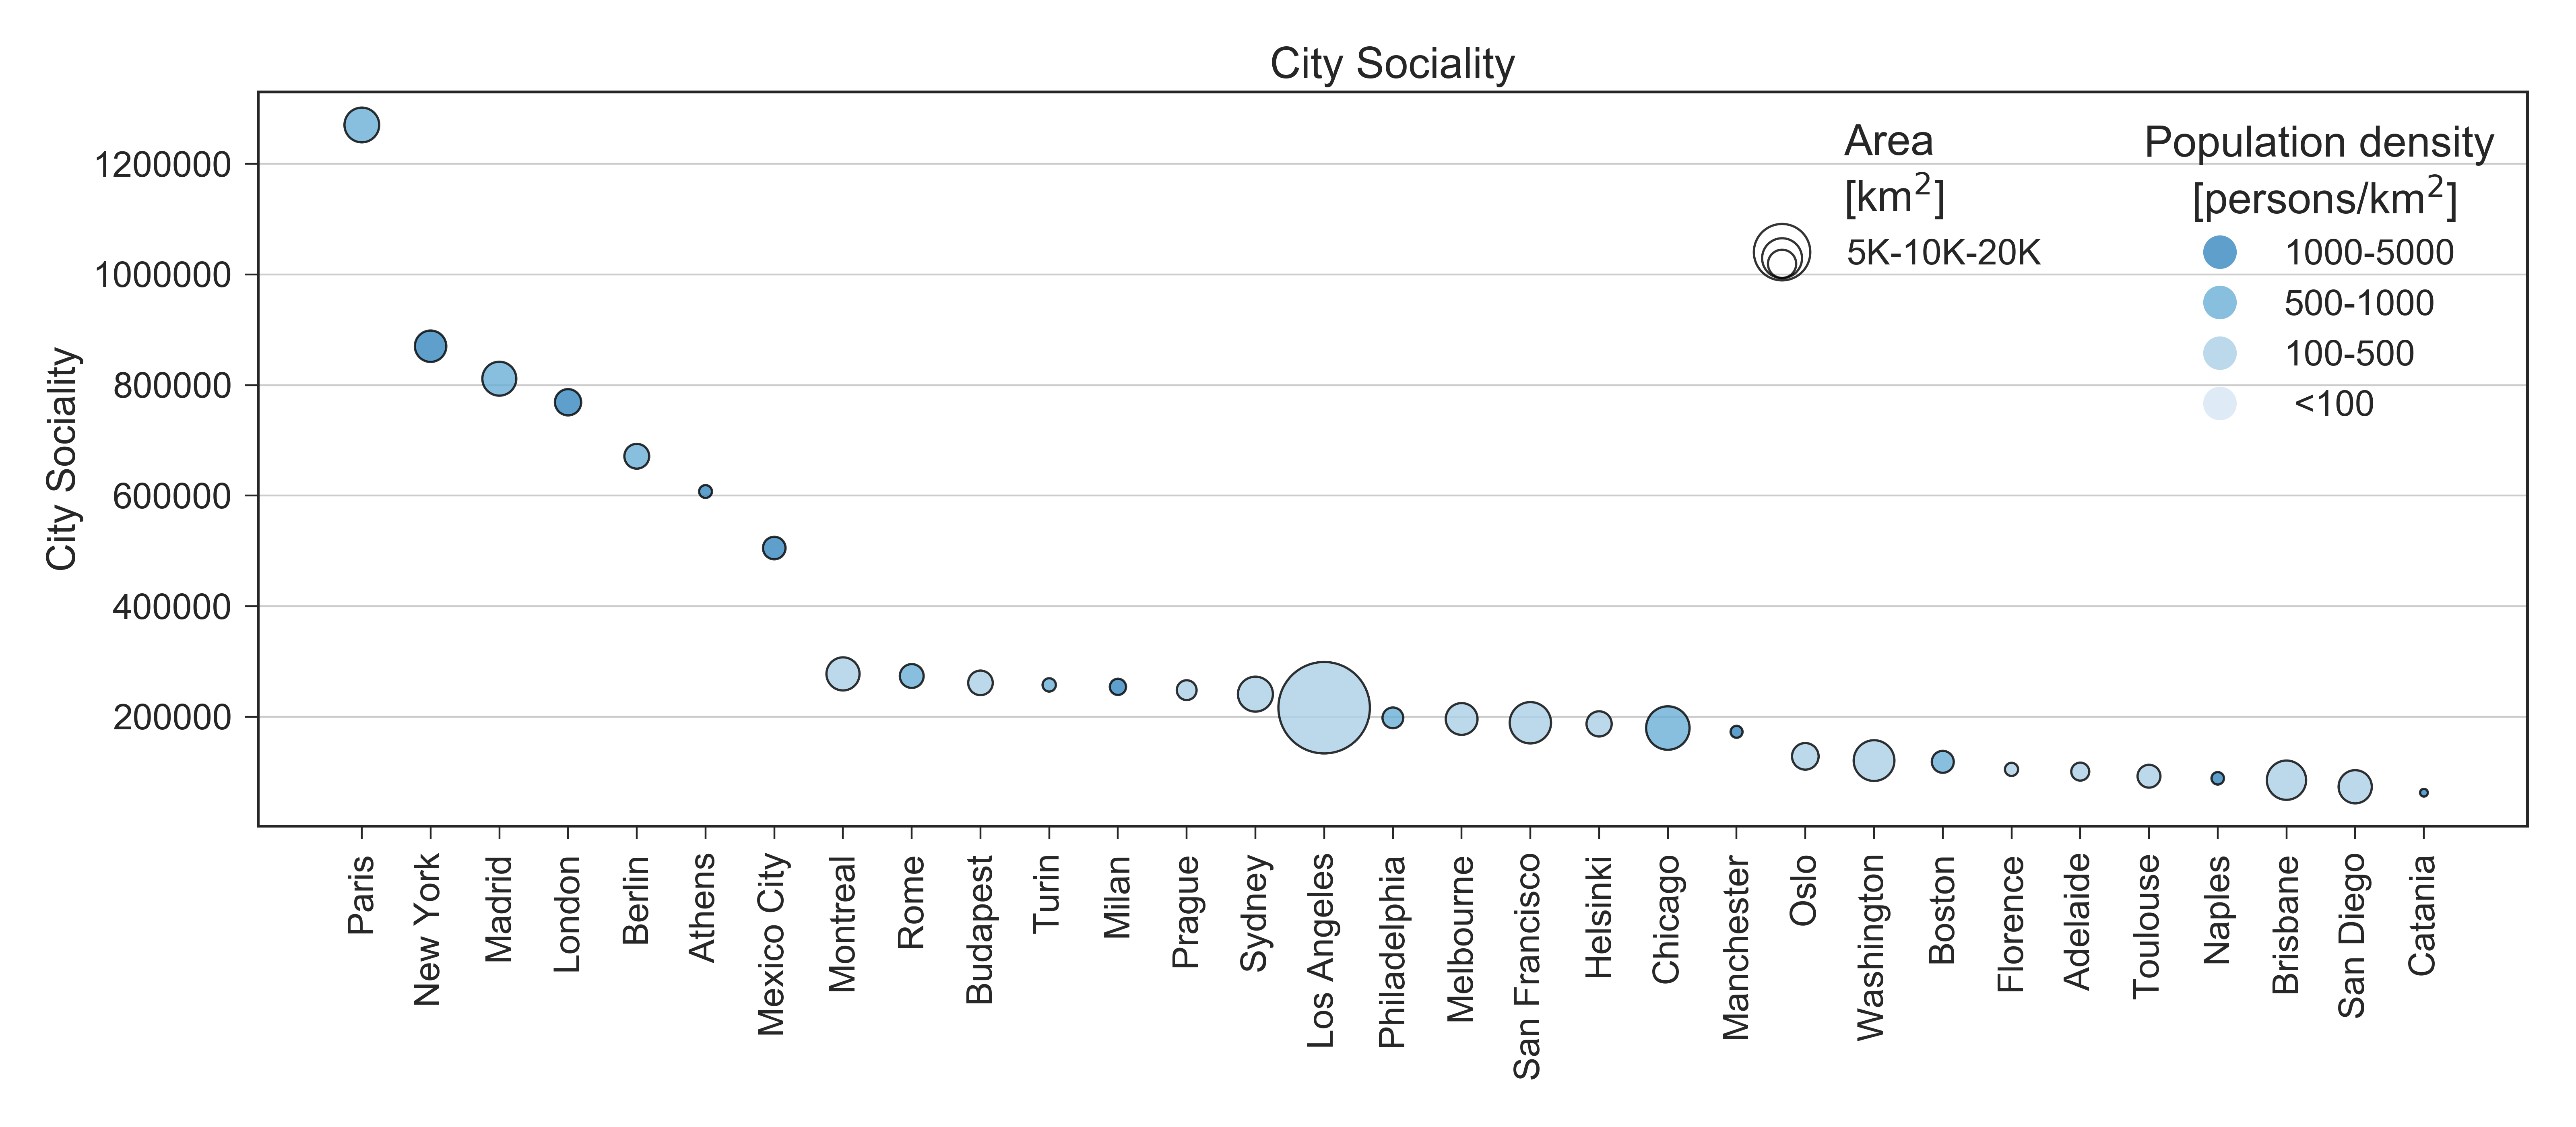
City Sociality
Sociality Score per person
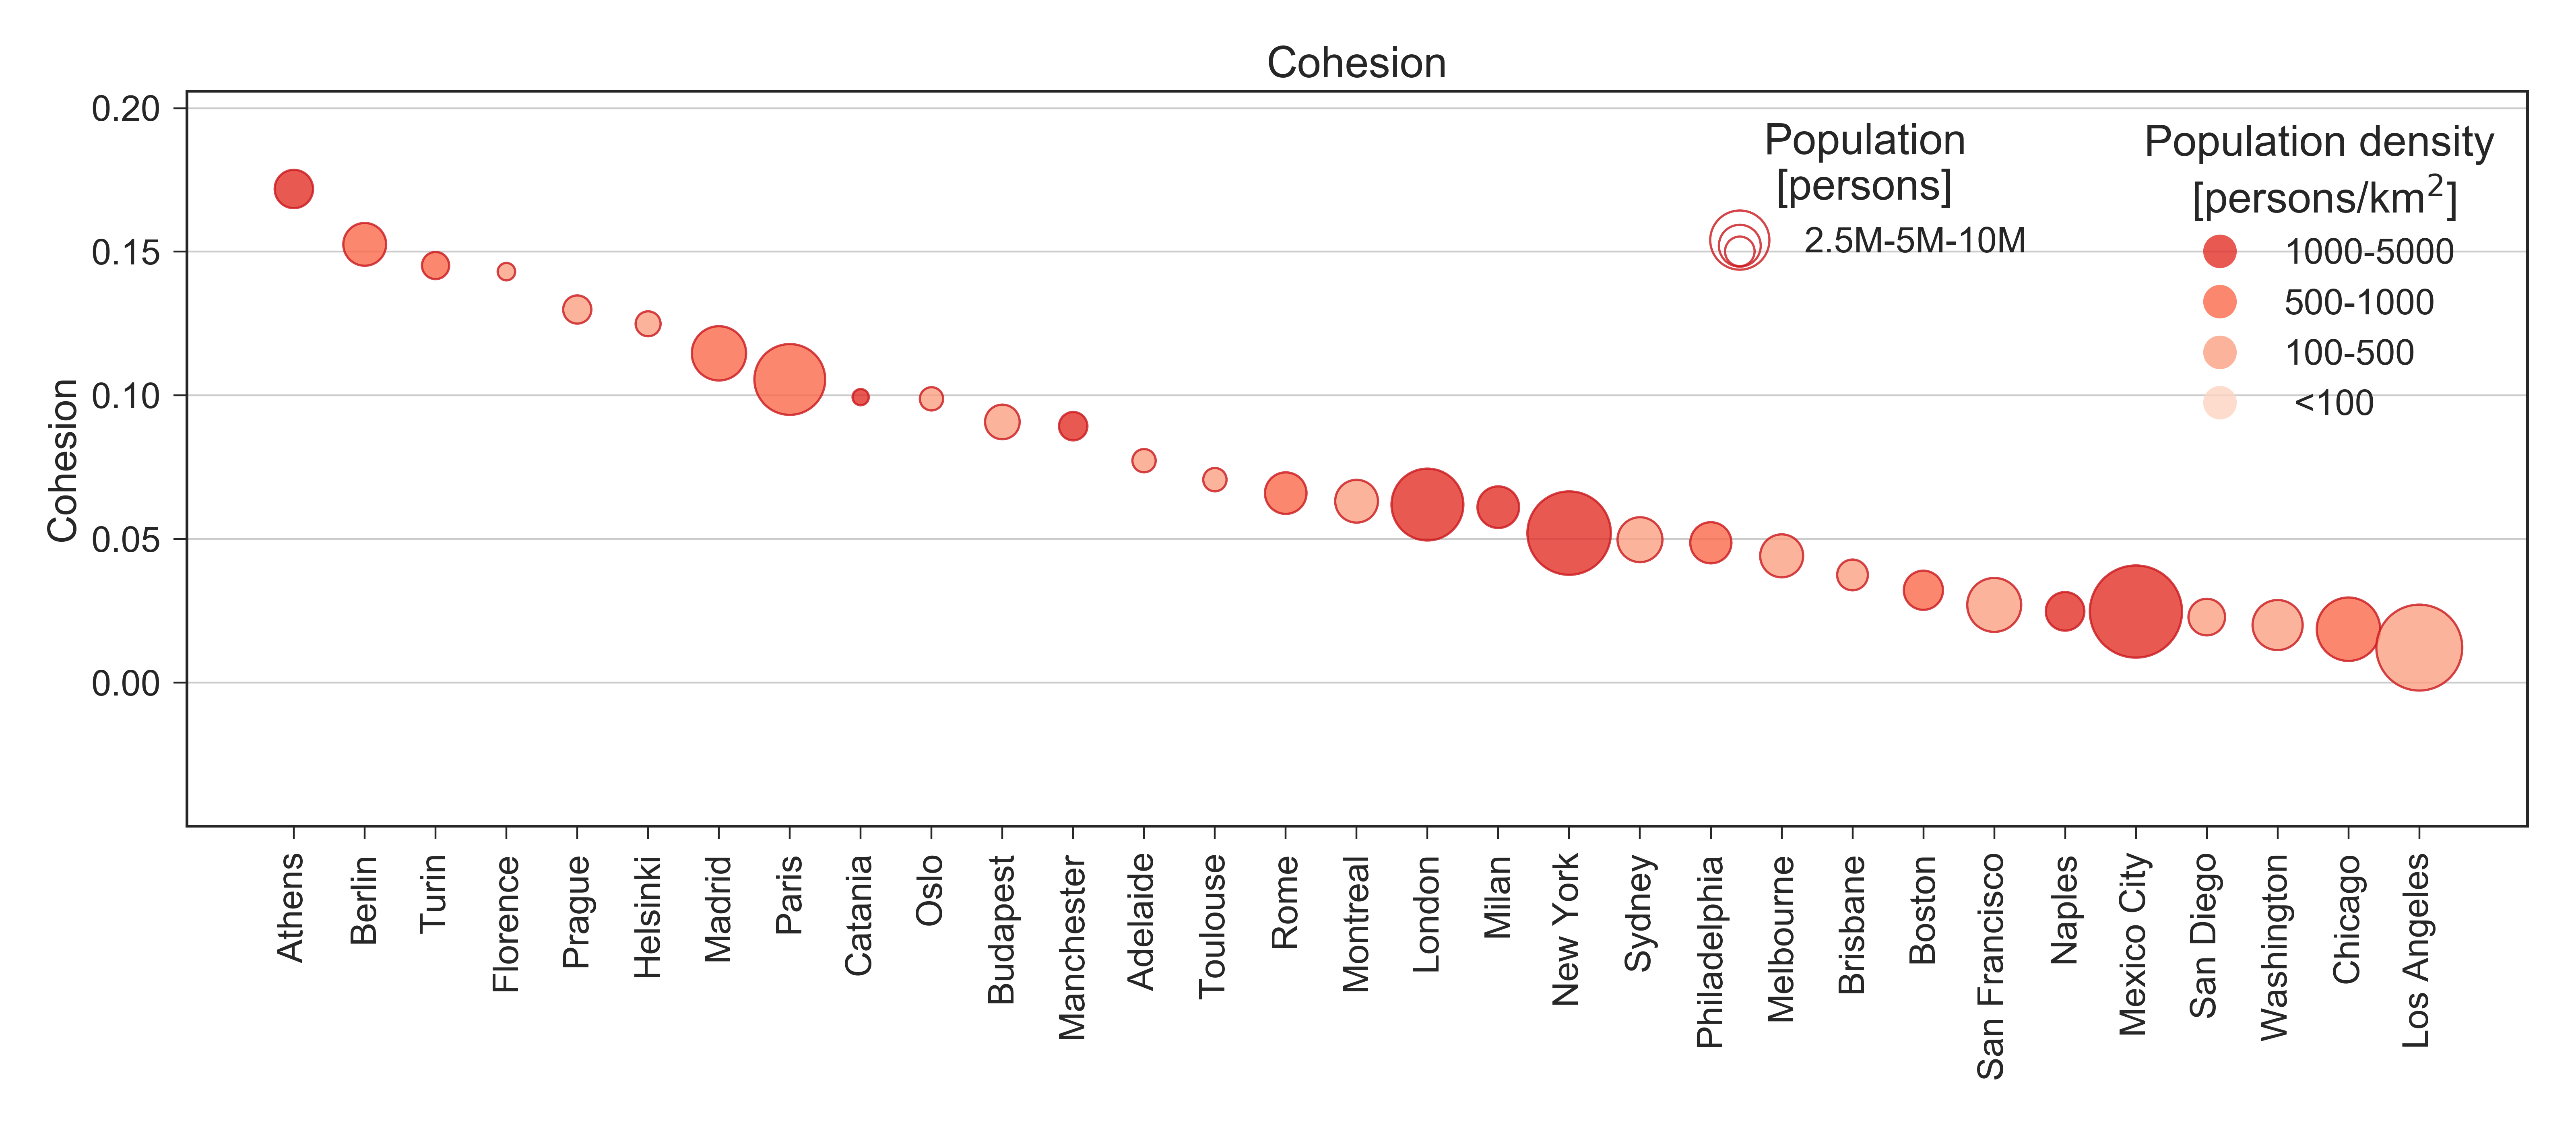
Cohesion
City Sociality divided by total population
CityChrone
Citizen for Science
New public transport scenario

How to improve the efficiency of public transport?

What is the best intervention given a budget?


Using users mind and computational resources

Prior knowledge of users.

Client-side computations.

Gamification aspect.


The future of public transports in cities
Bad ending for my current research, but happing ending for public transport in the cities?
Cars per 1000 inhabitants

Italy togheter with USA has the highest level of car ownership.

Italy cars Europe cars
Rome 800 Paris 225
Milan 596 London 298
Turin 600 Barcellona 350
Catania 700 Berlin 297
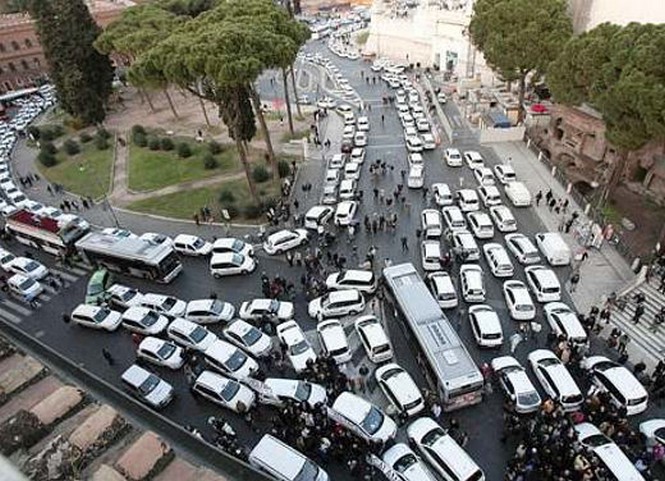
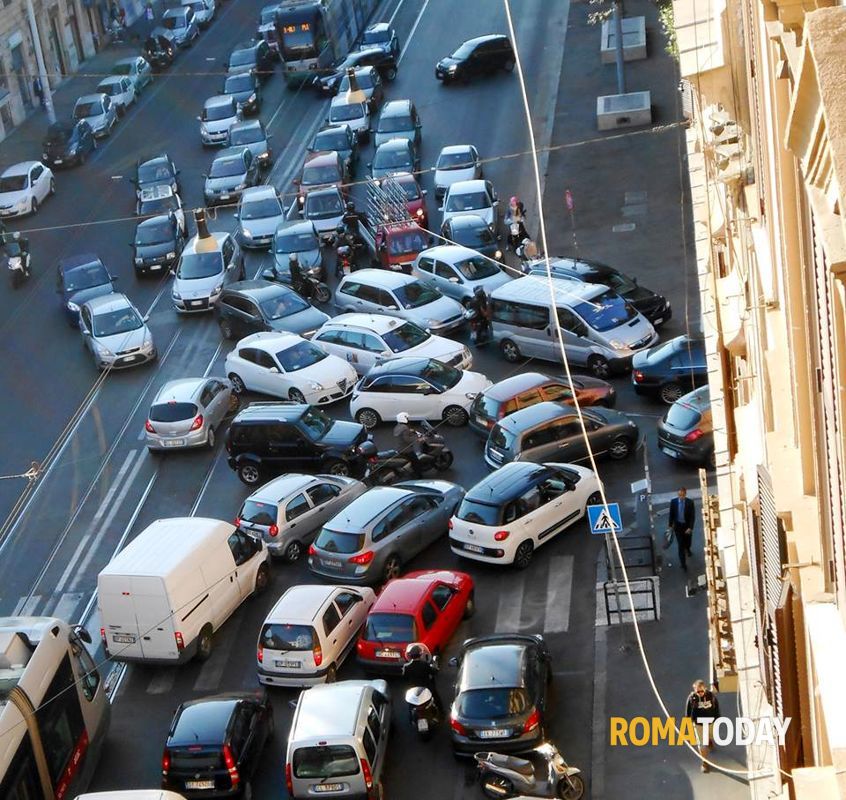
Average person per car 1.2


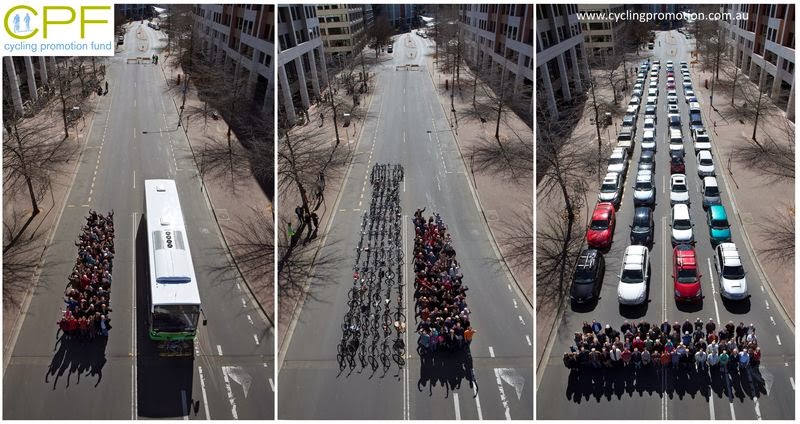
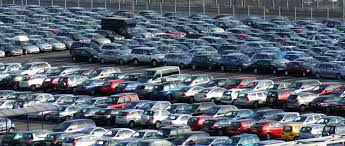
95% of the time the cars are parked
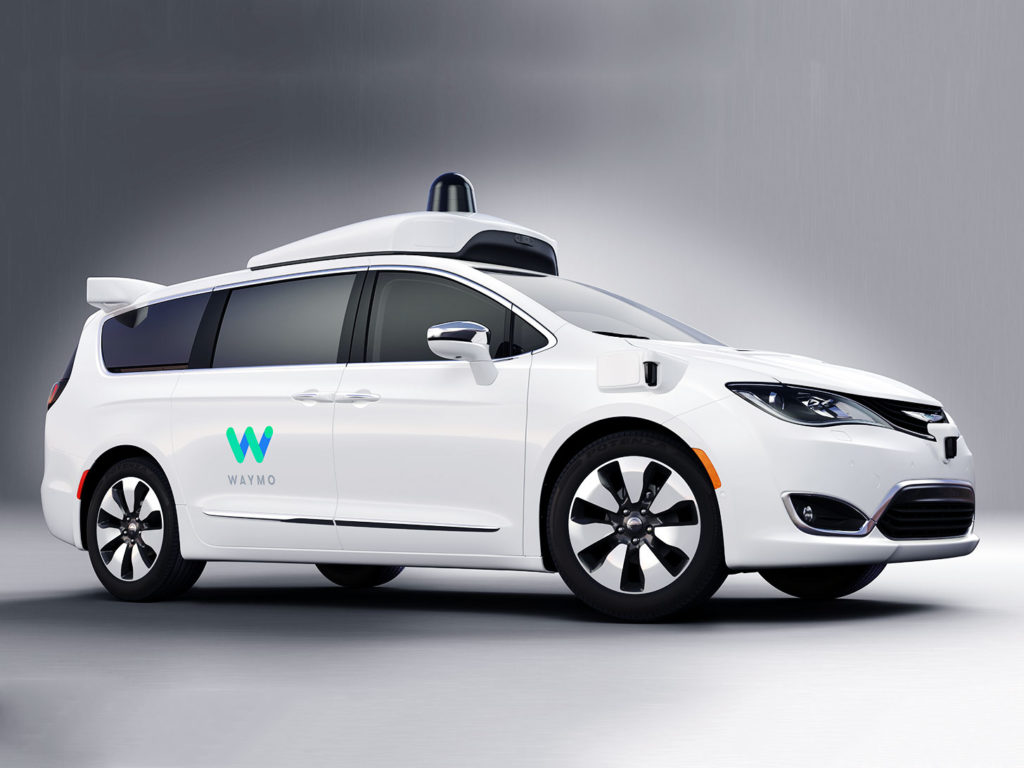
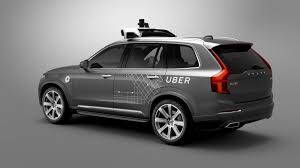
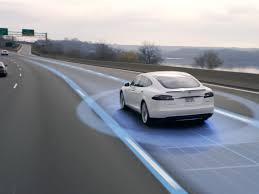
Self driving cars (they are around us)
No property - No Parking
Boost in efficency

Sharing Trips
from taxy sharing to trip sharing\(^{1,2,3}\)
At least 50% less cars circulating

Public transport on demand
shrinking of the cost urban transportation of almost 10 times.

1. P. Santi, G. Resta, M. Szell, S. Sobolevsky, S. Strogatz, C. Ratti. Taxi pooling in New York City: a network-based approach to social sharing problems (2013).
2. hubcab
3. shared-mobility-innovation-liveable-cities
Technical hints
The pythonic way to do science
Prerequesite

python(version 3)

notebook jupyter

Notions - Libraries

Interactive maps: folium

Matrix matlab_style (really fast): numpy

plots: matplotlib

Efficient data analisys: pandas

networks analisys: networkX (easy to use),graph_tools (fast as c++ tools)

need faster computations?: numba(compile python function, fast as c/c++ version)

... more... more

Do you want to make a complex website or app? Take a look to meteor, citychrone is made with it.