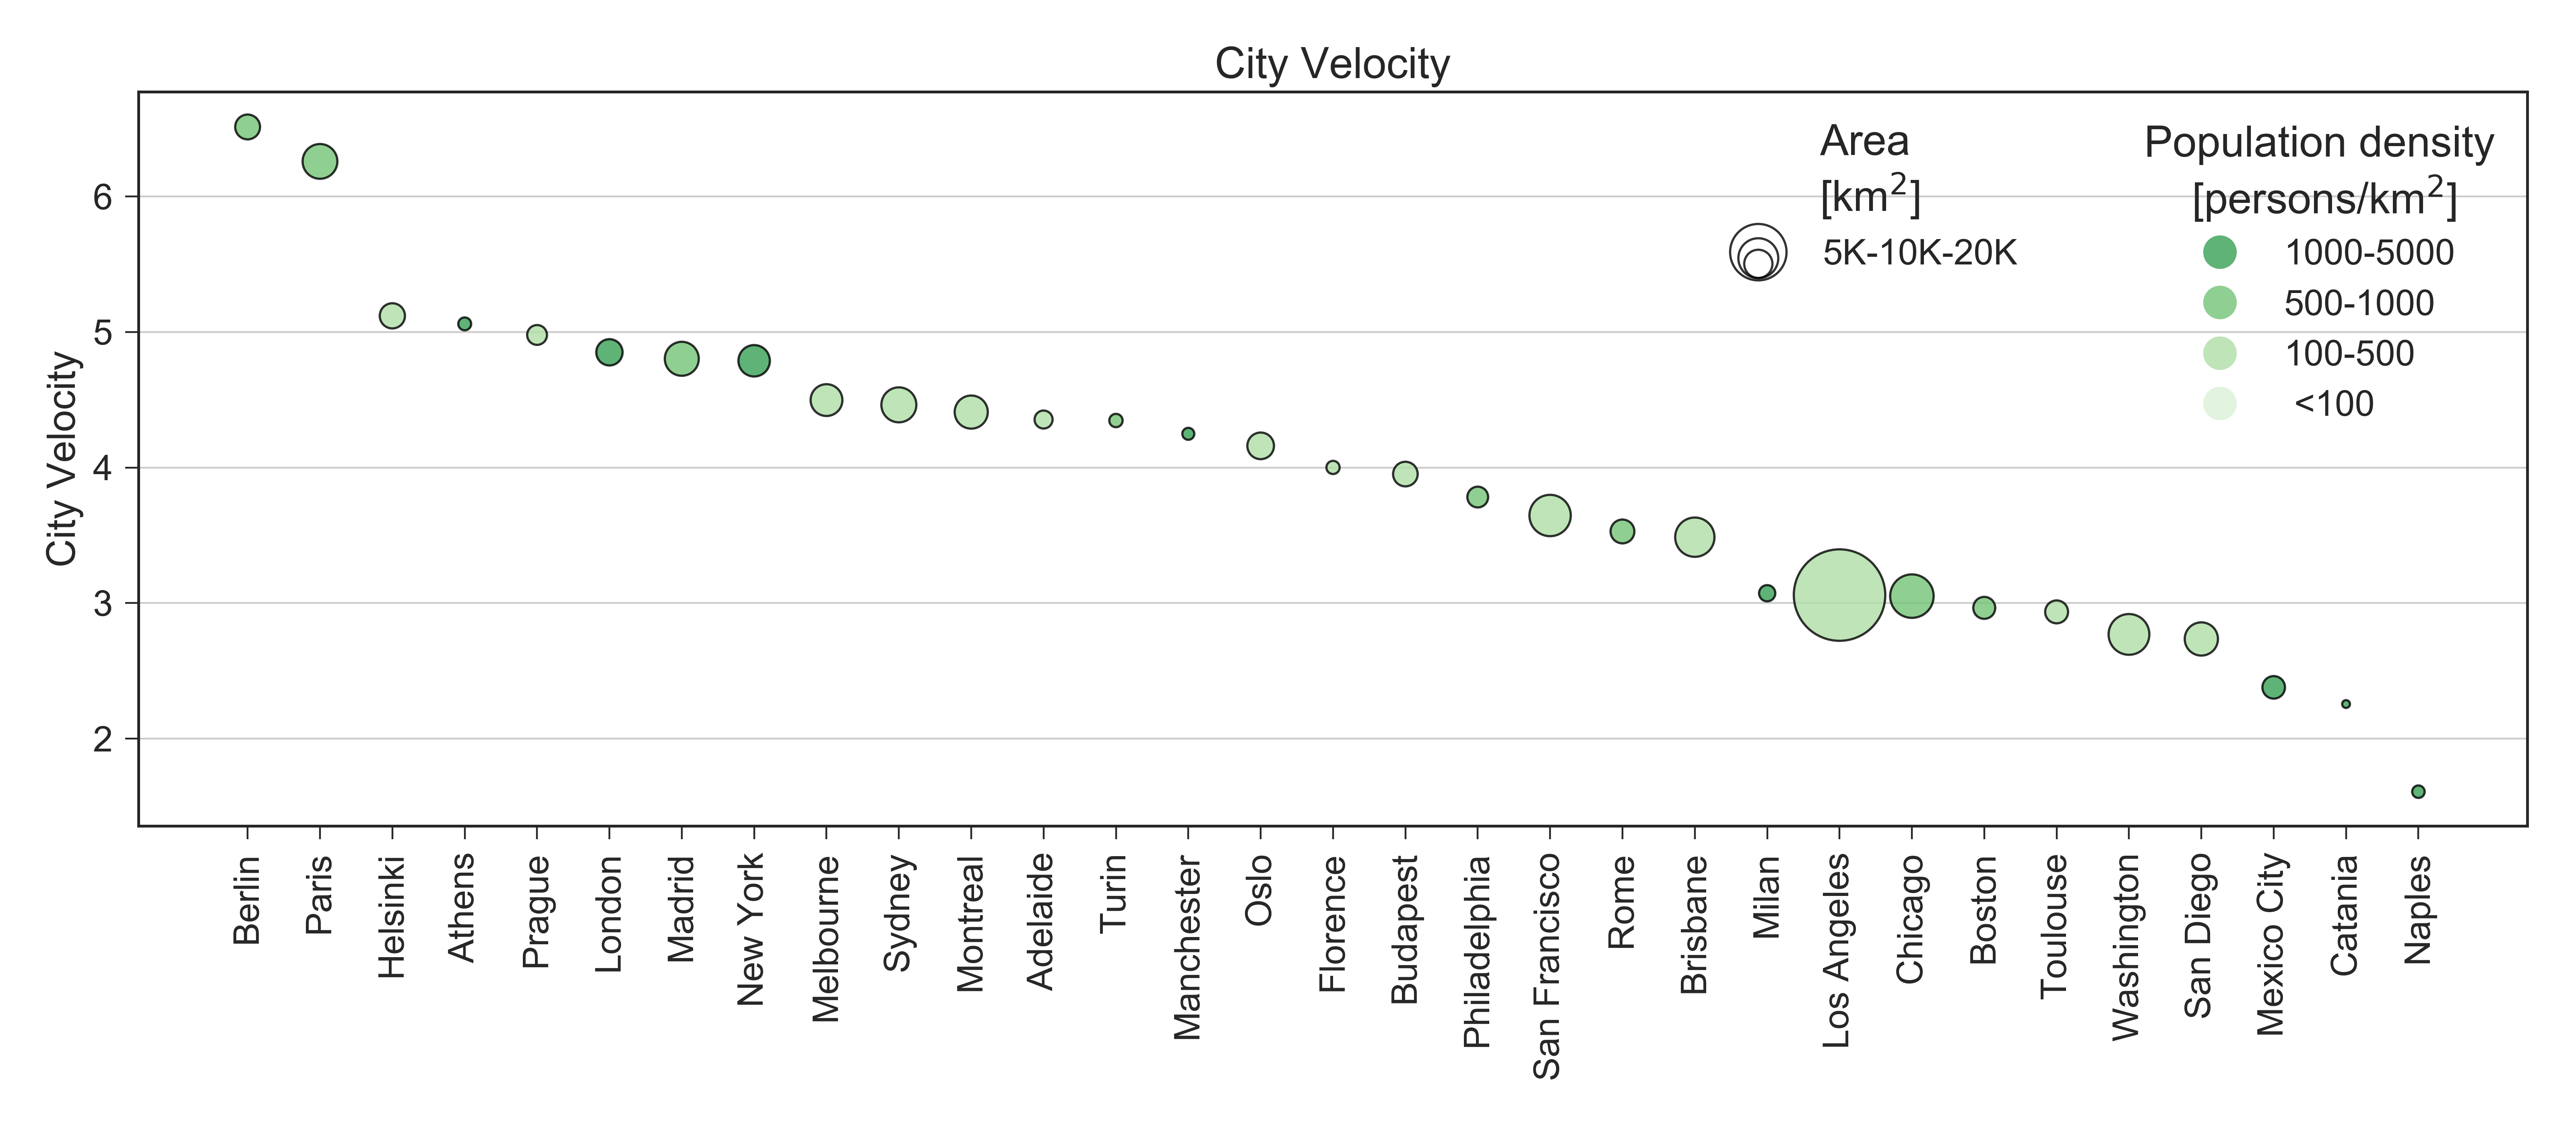
Consider the Area of the Isochrone a time \(t\) computed in \(P\):
\begin{equation}
r(t,P) = \sqrt{\frac{A(t, P)}{\pi}}
\end{equation}
dividing by time, we obtain a quantity with the dimension of a velocity:
\begin{equation}
v(t,P) = \frac{r(t,P)}{t}
\end{equation}
Integrating over time:
\begin{equation}
v_{score}(P) = \int_0^{\infty} v(t, P) f(2t) dt,
\end{equation}
\(f(t)^1\) is the daily time budget distribution for public transport.
The Velocity Score can be consider as the average velocity of a daily typical trip taking a random direction from \(P\).
\(^1\) Robert Kölbl, Dirk Helbing. Energy laws in human travel behaviour. New Journal of Physics 5, 48 IOP Publishing, 2003.
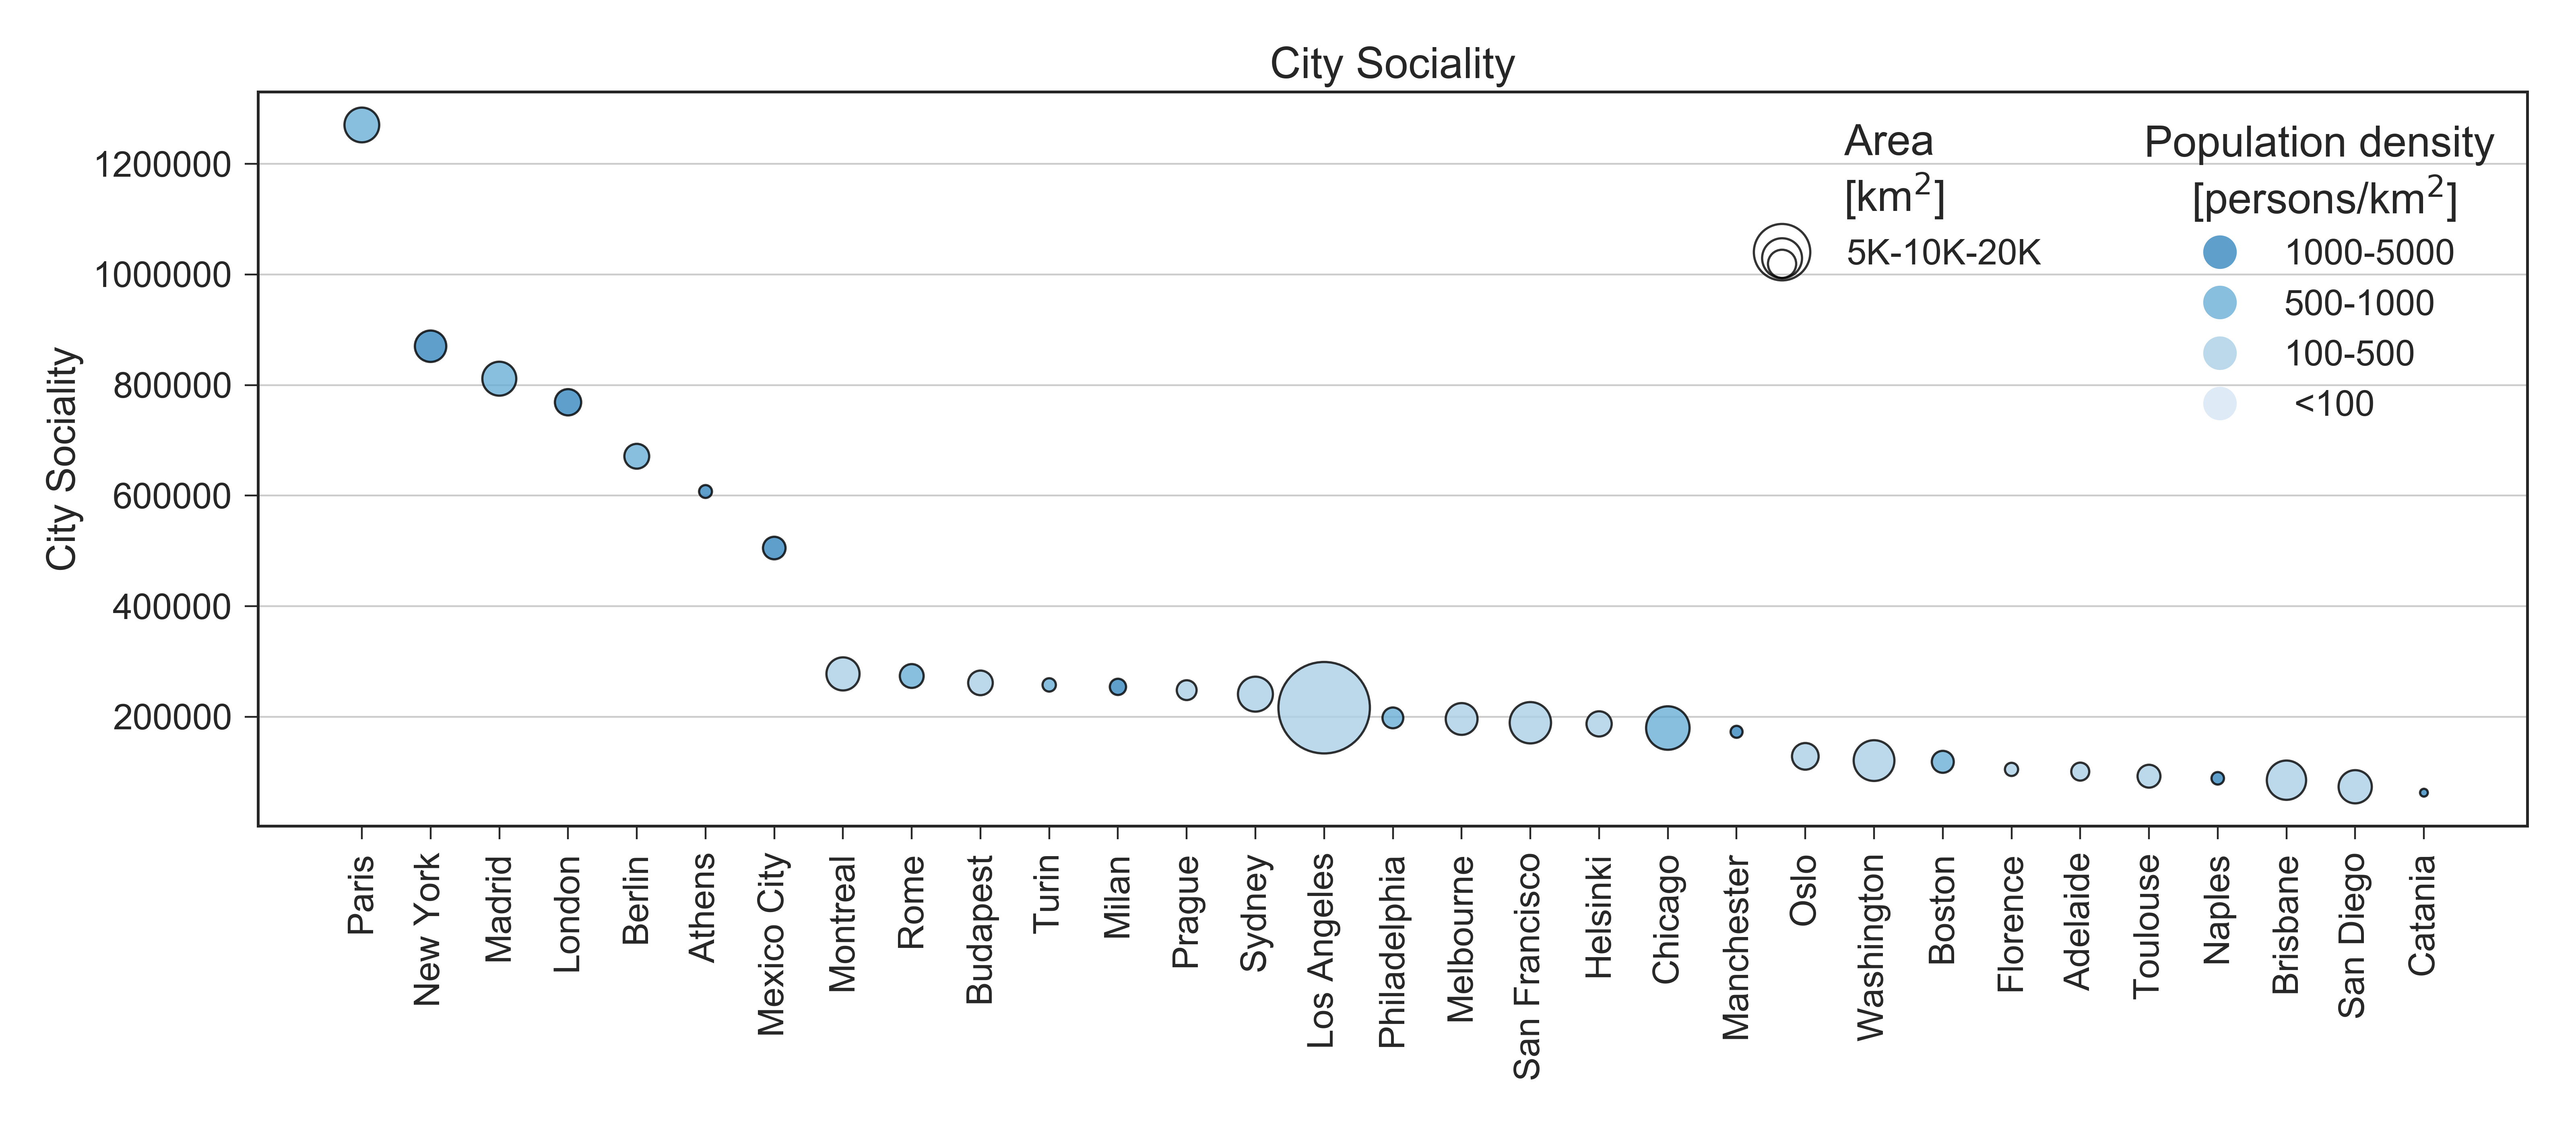
Sociality Score
Consider the populations inside the Isochrone a time \(t\) computed in \(P\):
\begin{equation}
s(t,P) = \sum_{i \mid t_i(P) < t} p(h_i),
\end{equation}
we sum over all the hexagons with time \(t_i\) less than \(t\) and \(p(h_i)\) is the population within \(h_i\).
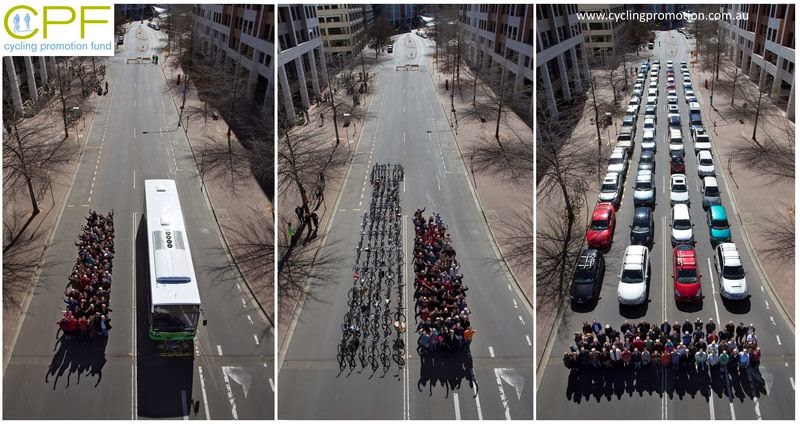
The future of public transports in cities
Bad ending for my current research, but happing ending for public transport in the cities?
Cars per 1000 inhabitants
Italy togheter with USA has the highest level of car ownership.
Italy
cars
Europe
cars
Rome
800
Paris
225
Milan
596
London
298
Turin
600
Barcellona
350
Catania
700
Berlin
297
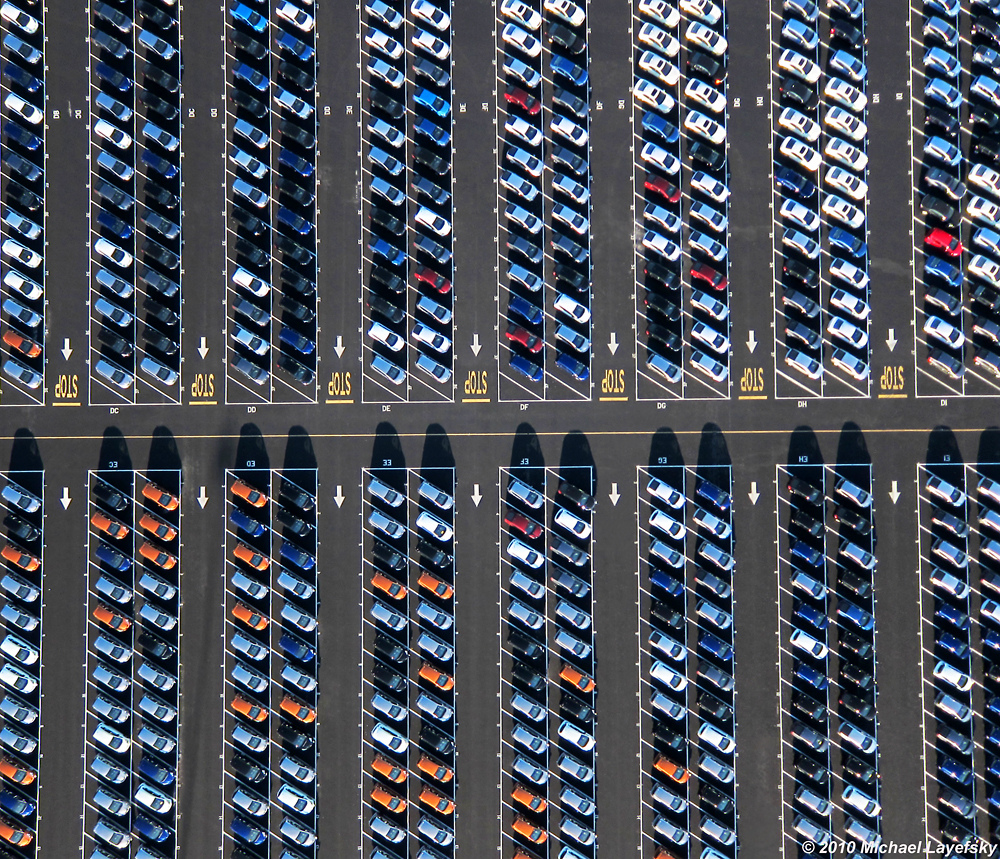
Average person per car 1.2
95% of the time the cars are parked
Self driving cars (they are around us)
No property - No Parking
Boost in efficency
Sharing Trips
from taxy sharing to trip sharing\(^{1,2,3}\)
At least 50% less cars circulating
Public transport on demand
shrinking of the cost urban transportation of almost 10 times.
1. P. Santi, G. Resta, M. Szell, S. Sobolevsky, S. Strogatz, C. Ratti. Taxi pooling in New York City: a network-based approach to social sharing problems (2013).